Showing posts with label heat map. Show all posts

Monday, May 9, 2011

Release 2011-05-09: Data Subsets

Scorecard Improvements

  • "Metric Subsets" have been renamed, "Data Subsets" because in addition to picking metric types, you can now choose your favorite sub-entities. This facilitates a greatly pared-down Heat Map, Metric Contributors, and Variance Analysis (when you add a Pareto analysis on the Process Review screen).
  • The Heat Map screen now has a Show Targets button to display targets as well as actuals. When not showing targets you can still hover over an actual value to see the target, units, and what-is-better (more/less/closer).
  • When showing targets, the Heat Map screen now shows a label indicating which row is actual and which is target.
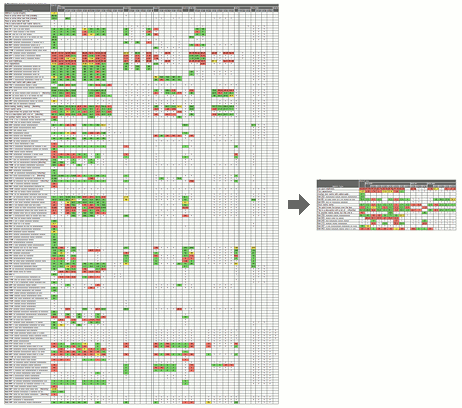
Focus reviews with data subsets

Businesses commonly track a large number of metrics on their scorecards, but individual leaders need to focus their reviews on the subset of data most meaningful to them. PlanBase Scorecard lets you define subsets of the metrics and sub-entities most essential to you for a more concentrated view of every Scorecard screen, but particularly of the Heat Map screen.

Use a subset by selecting it in the Data Subsets drop-down tab in the top navigation section of any Scorecard View screen. Selecting a data subset is sticky - it stays selected when you navigate between the Scorecard View screens. To view all metrics and entities again, select *All Data* from the same drop-down, or click a link in the left-hand navigation pane, or edit something on the Entity View screen.

Monday, January 10, 2011

Release 2011-01-10: Scorecard Metric Subsets

  • Each entity, function, or process owner can now create their own subset of metrics that are most important to them and navigate the Scorecard system showing only that subset. The new Edit Metric Subset screen makes it easy to select your favorite metrics. Any combination of metrics (within an entity) is allowed in a subset.
  • The Heat Map screen now suppresses (or at least dramatically shrinks) columns that have no metrics in them.
  • The old system of calling some metrics Entity KPIs or Function KPIs has been converted to the new system such that all the old Entity KPIs have been moved to the Metric Subset of the entity owner and the Function KPIs have been moved to the Metric Subsets of the function owners. The new system only allows one subset per-person per-entity and generally only entity or function owners can have their own subset.
  • Tip: Inform your direct reports that you will use your subset to review their progress.

Thursday, September 10, 2009

New Scorecard Features: Batch Data Load and Heat Map

Batch Data Load Screen

You can only access this screen if you have batch-data-load privilege, but you don't need the privilege to benefit from it! It allows someone (or a program) to automatically upload actuals and targets for multiple metrics at once. This is particularly useful when that data is provided by another system, but it can also be used to limit people's ability to enter data.

If you are an administrator with batch-data-load privilege, you can find the new screen in the left-hand navigation pane. It's designed for uploading a Tab-Delimited Text file (.txt) from a spreadsheet or other source. It is similar to the Metric Load screen but it allows loading multiple metrics at once. Before loading any metrics with this screen, you need to set those metrics up to be batch loaded. See the on-line help for full details.

Heat Map Screen

The Heat Map is a graphical representation of the current month's progress by metric vs. business unit. It shows all the key metrics across a BU, or function and highlights:
  • How each business units is performing across multiple metrics
  • Which metrics are challenging the most business units
  • If any key reviews for this period are missing


Instances of a Metric Type Screen

This screen shows every instance where a metric type is used and lets you check across-the-board performance. It is also useful for managing metric types and for investigations related to batch data loading. It displays the review status, trend, and concern for each metric.