
Thursday, August 3, 2017
Metric Promotion
Ad Hoc metrics can now mature into Scorecard metrics. The application manager can now edit a process and convert any Level 2: Auto-Assessed Ad Hoc metric to a Scorecard metric. This completes the path from the initial plan-to-do-anything approach that Ad Hoc metrics allow, to the carefully defined measurements that Scorecard metrics support.
Wednesday, December 7, 2016
Ad Hoc Metric Colors
Ad Hoc metrics can have auto-assessed green, yellow, or red statuses much like Scorecard metrics! An additional drop-down near the top of the Edit Ad Hoc Metric screen lets you select how mature (strict) you want your metric to be.

Don't worry, you can enter your metrics exactly as easily as you are used to without any adjustment or learning. Not a single extra click or key-stroke is required! We positioned the new Maturity drop-down at the top of the Ad Hoc Metric Edit screen with the cursor in the Definition field below it. If you want to use the new functionality for a specific metric, the drop-down is right there when you're ready for it:

Selecting Numeric maturity adds a Units field and requires all targets and actuals to be numbers (they are right-aligned to show this).

Selecting Auto-assessment allows the system to add color to your actual values when you enter them. Just like Scorecard metrics!

Auto-assessed metrics require you to set "what is better" and define how they are evaluated.

Plan View has not changed: metrics still show all the targets for the year.

Here's the Review View before the February review (click to expand image):

Let's update the review for February

Actual values for the metric are automatically colored according to their status! The over-all Review Status is still set manually by the person reviewing the strategy.

Better numbers (we defined what was better earlier) provide better colors in March (click to expand image)!

We hope you enjoy this new feature. Please reach out to us for more information.
Sunday, March 20, 2016
Mid-Year Updates
If you use yearly Scorecard metrics, you can now set them to be updated in a mid-year month.
You no-longer have to select a quarter-end month to see the values for quarterly Scorecard metrics, or a year-end month for Yearly metrics. Once entered, the values show up for the entire period.
The Entity CSV Download has a new column that indicates whether each metric is Monthly, Quarterly, or Yearly. If Yearly with a mid-year update month, it names the month.
Tuesday, February 16, 2016
Curvy Charts
Spark Charts now use wavy lines instead of straight ones. Hover over any data point to see the exact Target and Actual values.

Click on any chart to see a bigger version that's easy to copy into a spreadsheet or presentation. Charts on paper printouts of metric PDF reports are curvy now too!

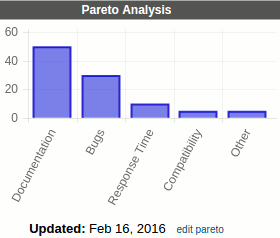
Pareto Charts now display vertical bars instead of horizontal ones.
The Tags, and Responsibilities screens now show the new charts by default (like the Process Review screen). Choose Rolling 15 Months from the Show: Metrics drop-down to see the raw data instead of a chart.
Click on any chart to see a bigger version that's easy to copy into a spreadsheet or presentation. Charts on paper printouts of metric PDF reports are curvy now too!

Pareto Charts now display vertical bars instead of horizontal ones.
The Tags, and Responsibilities screens now show the new charts by default (like the Process Review screen). Choose Rolling 15 Months from the Show: Metrics drop-down to see the raw data instead of a chart.
Sunday, November 1, 2015
Plan Diagnostics Report
This new page is like a health check-up for your planning process. It displays the following statistics about the selected plan:
Reviews
Has this plan been reviewed effectively?
Achievements
Over all, how well are we achieving this plan?
Creation
How well did we define what we planned to do?
Most of the numbers link to custom reports on the Plan Status screen that show exactly how the number was calculated. Only the Missing Owner numbers link to the Ownership Transfer screen. A Show Percentage control in the gray top-navigation toggles most fields from showing counts to showing percentages.
Sunday, August 30, 2015
Yearly Scorecard Metrics
Now we support metrics with a single update per year. Also:
- Improved Time Frame drop-down lets you select "Rolling 15-month", "Fiscal Year", or "7-Year" view (to better accommodate yearly metrics). The Rolling and Fiscal views come in Monthly, QTD, and YTD flavors. 7-Year is only YTD. More...
- The new Time Frame drop-down also affects graphs on Process Review, Tags, and Responsibilities screens and the Metric PDF download.
- The Transfer Ownership screen now has Select All check-boxes to make it even easier to move all someone's Hoshin or Scorecard responsibilities to someone else.
Tuesday, May 5, 2015
Responsibilities Shows a Review Dashboard Much Like the Tags Report
This report still shows a user's strategies, tactics, and Scorecard metrics on one screen, but now it shows a "review" perspective with the latest updates, start- and end-dates, and graphs:
 This is the same format as the Tag report and includes the same control parameters so that you can customize the report to your liking. You can view other people's Responsibilities, but like the rest of the system, you only see items that are already visible to you. Use the up and down arrows to move between users alphabetically, or pick one from the drop-down with your mouse.
Subscribe to:
Posts (Atom)