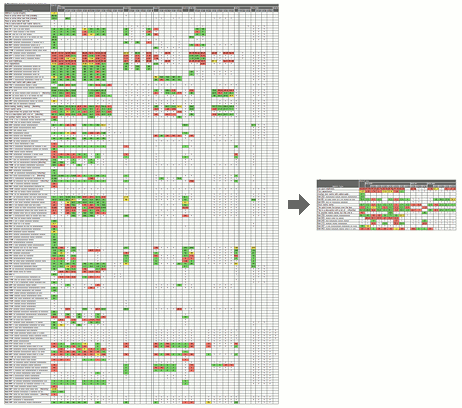
Spark Charts now use wavy lines instead of straight ones. Hover over any data point to see the exact Target and Actual values.
Click on any chart to see a bigger version that's easy to copy into a spreadsheet or presentation. Charts on paper printouts of metric PDF reports are curvy now too!
Pareto Charts now display vertical bars instead of horizontal ones.
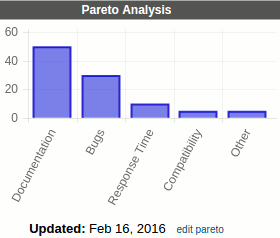
The Tags, and Responsibilities screens now show the new charts by
default (like the Process Review screen). Choose Rolling 15 Months from the Show:
Metrics drop-down to see the raw data instead of a chart.
Showing posts with label visual management. Show all posts
Tuesday, February 16, 2016
Monday, November 17, 2014
Tagging Tactics and Metrics
Tag your favorite strategies, tactics, and metrics to make them easier to search for, or to group them for reporting.
This report can show 15 months of numeric data for metrics, or it can show spark charts.
Other reports in the system are aligned by person, by plan, or by process. This new tag report lets you identify similarities and pick items from all your data to report on.
This report can show 15 months of numeric data for metrics, or it can show spark charts.
Other reports in the system are aligned by person, by plan, or by process. This new tag report lets you identify similarities and pick items from all your data to report on.
Thursday, December 1, 2011
Release 2011-11-30: Improved graphs and Move Strategy
Improved graphs in PlanBase Scorecard bring a new level of visual management to performance measurement:
Inquire today about how PlanBase Hoshin and PlanBase Scorecard can elevate your planning and process improvement!
- Green, yellow, and red background shading highlights on-track, behind-plan, and off-track performance over time.
- Click on any graph to display a full-size version suitable for presentations, printing, or copying to other applications outside of PlanBase Scorecard
- Move an objective/strategy to a different part of a plan
- Combine one plan into another
- Promote an objective/strategy to its own new plan.
Inquire today about how PlanBase Hoshin and PlanBase Scorecard can elevate your planning and process improvement!
Monday, May 9, 2011
Release 2011-05-09: Data Subsets
Scorecard Improvements
- "Metric Subsets" have been renamed, "Data Subsets" because in addition to picking metric types, you can now choose your favorite sub-entities. This facilitates a greatly pared-down Heat Map, Metric Contributors, and Variance Analysis (when you add a Pareto analysis on the Process Review screen).
- The Heat Map screen now has a Show Targets button to display targets as well as actuals. When not showing targets you can still hover over an actual value to see the target, units, and what-is-better (more/less/closer).
- When showing targets, the Heat Map screen now shows a label indicating which row is actual and which is target.
Businesses commonly track a large number of metrics on their scorecards, but individual leaders need to focus their reviews on the subset of data most meaningful to them. PlanBase Scorecard lets you define subsets of the metrics and sub-entities most essential to you for a more concentrated view of every Scorecard screen, but particularly of the Heat Map screen.
Use a subset by selecting it in the Data Subsets drop-down tab in the top navigation section of any Scorecard View screen. Selecting a data subset is sticky - it stays selected when you navigate between the Scorecard View screens. To view all metrics and entities again, select *All Data* from the same drop-down, or click a link in the left-hand navigation pane, or edit something on the Entity View screen.
Monday, February 28, 2011
Release 2011-02-28: Pareto Analysis
Scorecard Improvements
- Added an optional Pareto analysis and Variance analysis to each process and metric review (on the Process Review screen).
- "Tactic Assigned" and "Review Overdue" messages are now generated for process improvements and corrective actions as well as tactics.
- Now everyone has access to the Load Metric screen (formerly only the Application Manager had access). It works like the Batch Data Load screen except it only loads one metric at a time and it's designed to be used by cutting and pasting data directly from your spreadsheet into the system. This makes it even easier for each metric reporter to enter their own data (and historical data too). Look for the little blue load link next to your favorite (non-batch-loaded) metrics on the Business Unit screen.
Usability Improvements
- Made Metric Subsets stickier - now editing a metric or updating a review leaves you in the subset you were in. Editing a process or function or clicking something in the left-hand navigation still pops you out of the subset.
- The subset name now appears at very top of the screen, making it more obvious and mirroring the way the Function View works.
- Changed name of "Scorecards" and "Plans" section in left-hand navigation to "My Scorecards" and "My Plans" for clarity.
- (Brief) message on each user's home page announces the new release.
Security Improvements
- We now store each password using multiple rounds of SHA-512 hashing with unique salt for each user, which is currently state-of-the art for making passwords "unrecoverable."
- This increases the maximum password length. All alphabets of the Unicode Basic Multilingual Plane (BMP) are still supported in both the password and user ID (and every other field in the system).
- We have also improved our password requirements (to encourage people to make better passwords), by adding several popular passwords to the list of reserved words and by prohibiting 4 or more of the same character in a row (e.g. 1111, AaAa, etc.).
- To take advantage of the new storage you must change your password.
- Ninety days after this release, anyone who hasn't changed their password yet will be forced to change it.
- It is still each user's responsibility to use a unique password for every account, to make each password strong, unguessable, compliant with their organization's security guidelines, and to keep each password secret, never sharing it or their account with others for any reason.
- PlanBase is continually looking for ways to improve security, not just password security. PlanBase encourages people to use good passwords by having password requirements, by making helpful suggestions, and by storing passwords securely. But even PlanBase cannot protect you against a hacker outright guessing your password (on the first try), or stealing a reused password from another site and using it to access this one. Only you can choose a unique, unguessable password for each of your accounts and store them securely. Please do your part to keep your account, your company, and PlanBase applications secure.
Wednesday, December 15, 2010
Release 2010-12-13: Hoshin/Scorecard Integration
In the works for months, this is a major release with a number of important enhancements.
Tactic Improvements
- Improved visual management of tactics, process improvements, and corrective actions. Months are now color coded based on progress. Question-marks, dashes, and colorful symbols show the current status or indicate overdue reviews.
- Tactics can now be shared between strategies in Hoshin plans and processes in scorecards.
- Tactic Assigned and Review Overdue messages now apply to process improvements and corrective actions as well as tactics.
- Monthly reviews for tactics. All your previous data is saved and can be reviewed monthly.
- The Edit Tactic screen has been completely redesigned to require fewer keystrokes to enter or edit tactics. Related tactics can be added with a single click.
- The Tactic Complete logic mirrors the Strategy Complete logic, but does not require manager approval.
- Tactics (including process improvements and corrective actions) are now visible until they are complete.
Other Improvements
- Objectives and strategies can now be linked to your entities and functions in Scorecard. This allows you to jump between your related plans and scorecards with a single click.
- You can still add text "tags" to objectives and strategies, then filter by those tags on the Plan Status screen.
- Users of Hoshin and Scorecard can set a lowest-level strategy to improve a process, allowing you to share tactics and metrics with that process by picking them from a list. This eliminates time and effort when developing and reviewing plans.
- The Process Review screen functions like a dynamic A3 chart, showing all process improvement tactics and metric corrective action tactics together, even if some of those tactics were originally entered in Hoshin and others in Scorecard. The new display includes color-colored months, showing the progress of process improvement and corrective action tactics over time.
- Similarly, the Implementation Review screen has been improved to color-code each month of tactic progress.
- Hoshin-only users can now see the Entity and Function screens (minus any targets or actuals).
- The Responsibilities screens for Hoshin and Scorecard have been combined.
- A new Show Me feature adds a collection of short e-learning modules for features of the Hoshin and Scorecard applications.
- The left-hand navigation pages for Hoshin and Scorecard have been combined. Only the bottom section that shows your plans or scorecards now changes with respect to which product you are viewing. The link to switch between views is now at the top of that section.
- Mail is addressed differently to make it more likely for the Application Manager to receive returned mail or any replies to application-generated mail.
Subscribe to:
Posts (Atom)